Reports are where everything comes together. In this section, you will learn how to create a fantastic way to represent your data.
As in the Visualizations section, there are two possible workflows to create a report, first is when you click on “Reports” in the sidebar.
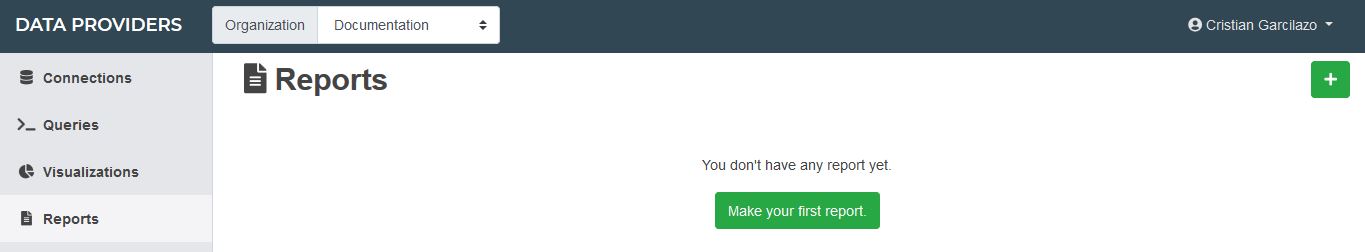
Clicking on the plus sign on the right you can add one report.
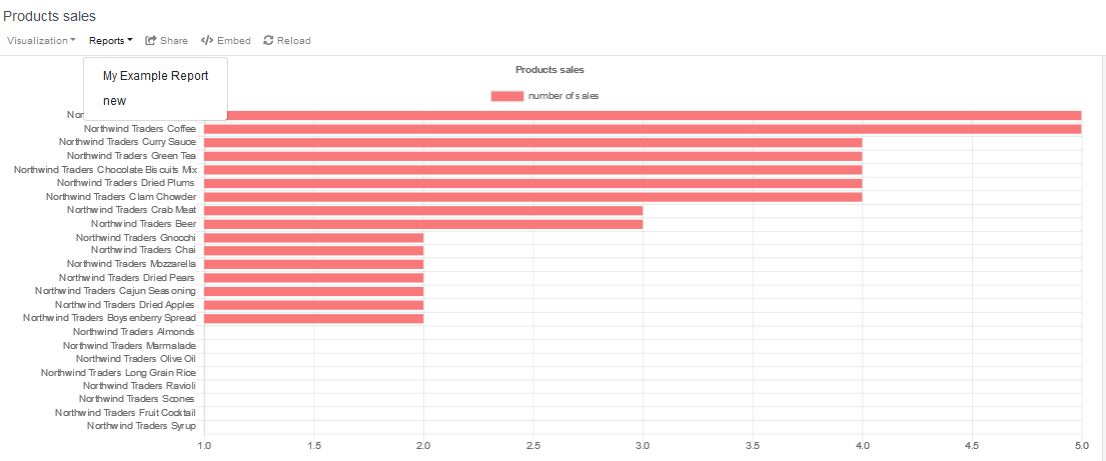
Second is when you use the visualization builder menu, in that case the visualization will appear in the report builder, we are going to make an example.
From the “Report sales” visualization, in the “Reports” section we are going to be able to see all the reports where this chart is being used, also we can go to the report builder by clicking in the “New” option.
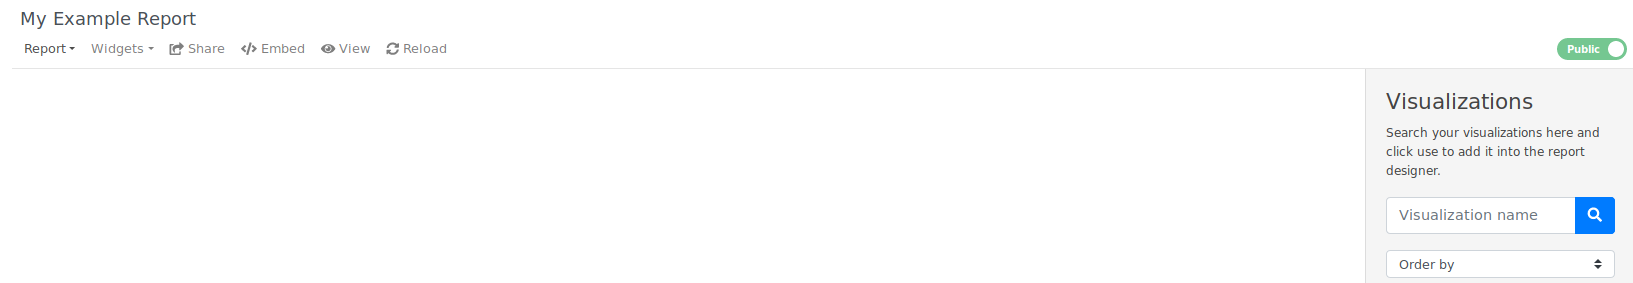
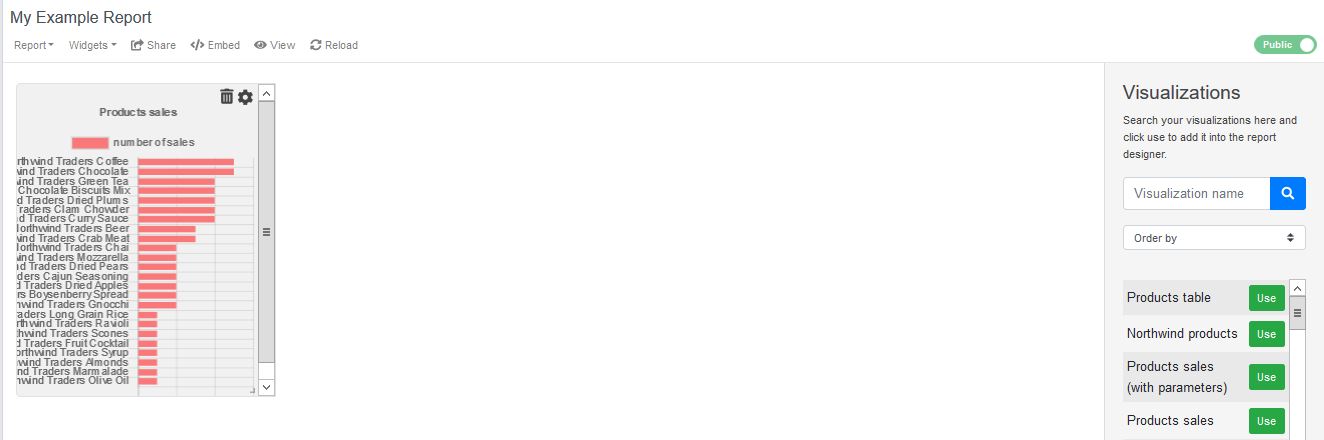
Then you will be redirected to the report builder, and the visualization that you came from will appear already in the grid, like in this example
Now, let’s talk about the sections you will find:
The toggle that indicates the report status, it could be “Public” or “Private”.

The header, where you will find options as “Save”, “Share”, “Embed”, “Reload” and the available widgets which you can use in your reports.

The report toolbar, where you will find all the visualizations which belong to your organization.
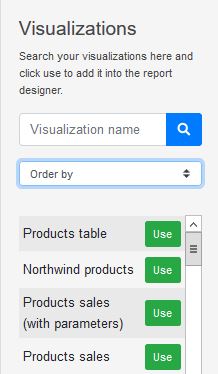
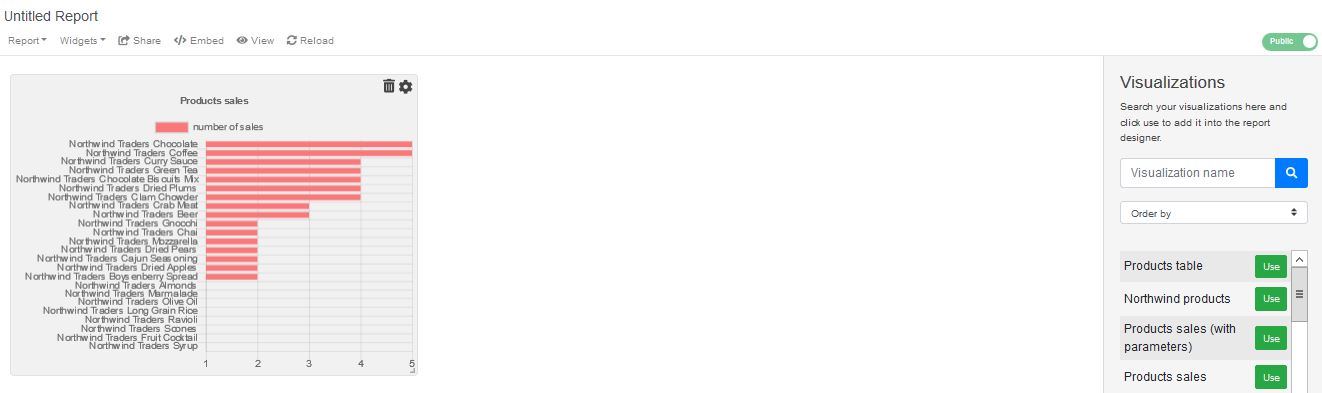
Once you click “Use” to add a visualization into the report builder, the fun begins, let’s add the different types of visualization that we already create in the Visualization section.
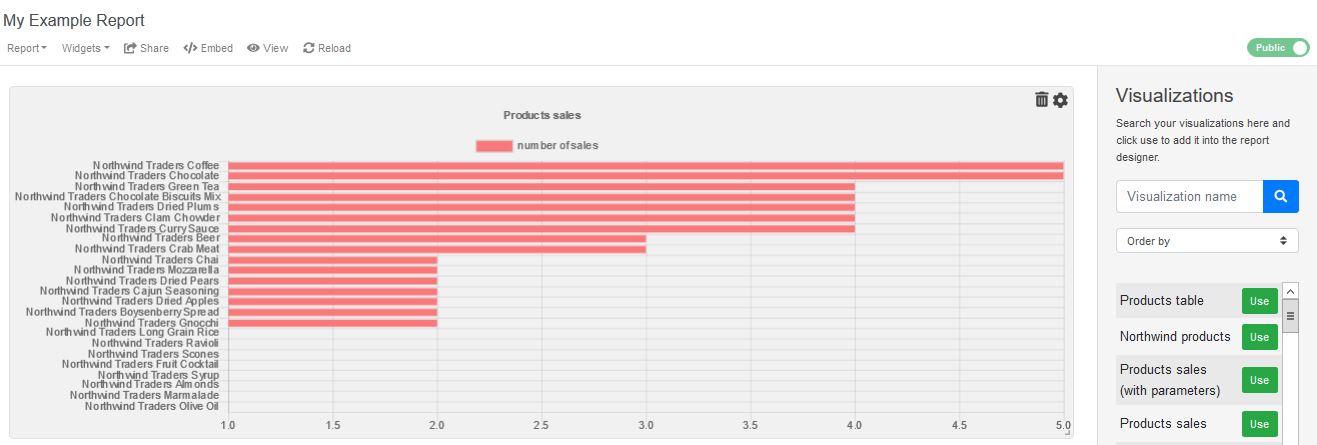
First we are going to add the “Products sales” chart and see what happens.
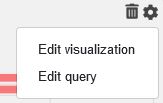
The available options over a visualization are the possibility to remove it from the query builder any time you want, and the “Settings” that allow you to go edit the visualization or the associated query.
Other important options for each visualization are the possibility to move it all around the report grid and change its size.
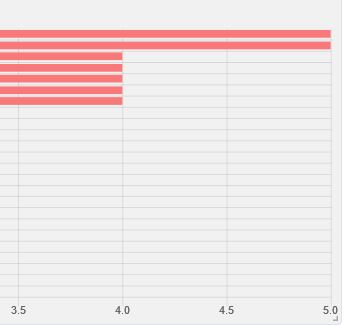
Use the bottom right corner to resize your visualization and maintain click over it to move it.
Here you can see a simple example with just one visualization:
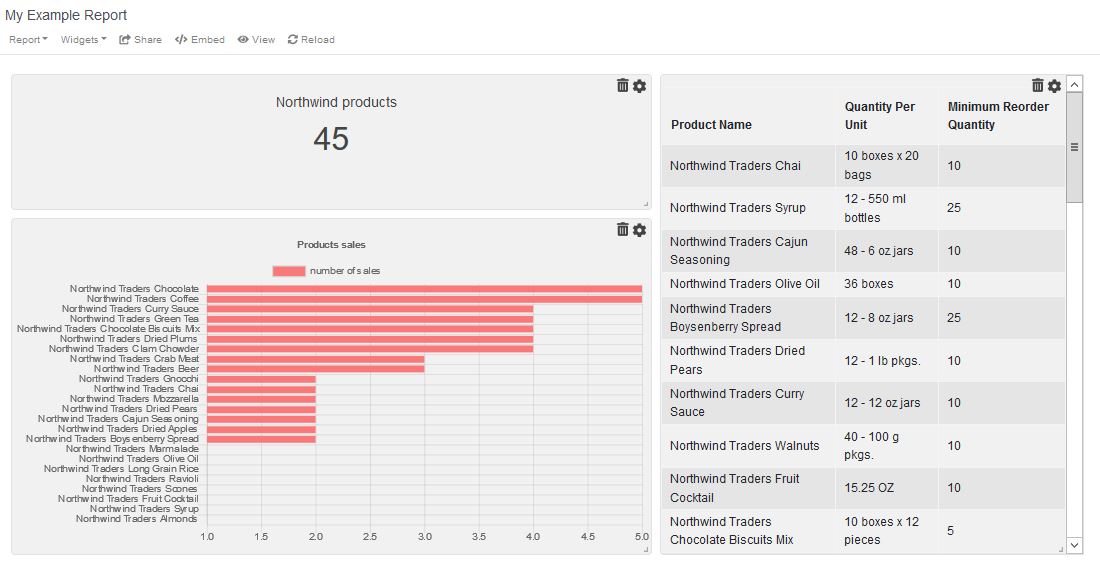
An example with different types of visualizations:
Resume
In this section, we teach you about how to create a report, use your imagination to combine any kind of visualizations with the purpose of make good decisions.