Queries
NOTE : we will not cover here details about SQL language.
In the Queries section, you can write a SQL sentence compatible with the RDBMS behind the connection, this sentence will be sent from Data Providers to your RDBMS to be executed. If it’s all ok the execution will be successful and the data will be sent back to Data Providers. The result of the execution, basically a table with data, will be used later in visualizations to be present it to your users.
You can write any kind of SQL query but it must be compatible with your RDBMS, for example, a Query for PostgreSQL it might not be exactly the same as a query for MySQL. We don’t add any intermediary language or some custom SQL, we just execute the written query in your server, no middle man magic. So it’s very important that you know your RDBMS features very well to get the maximun power of Data Providers.
Create your first query
Let’s create your first query, first go to Queries on the right menu.
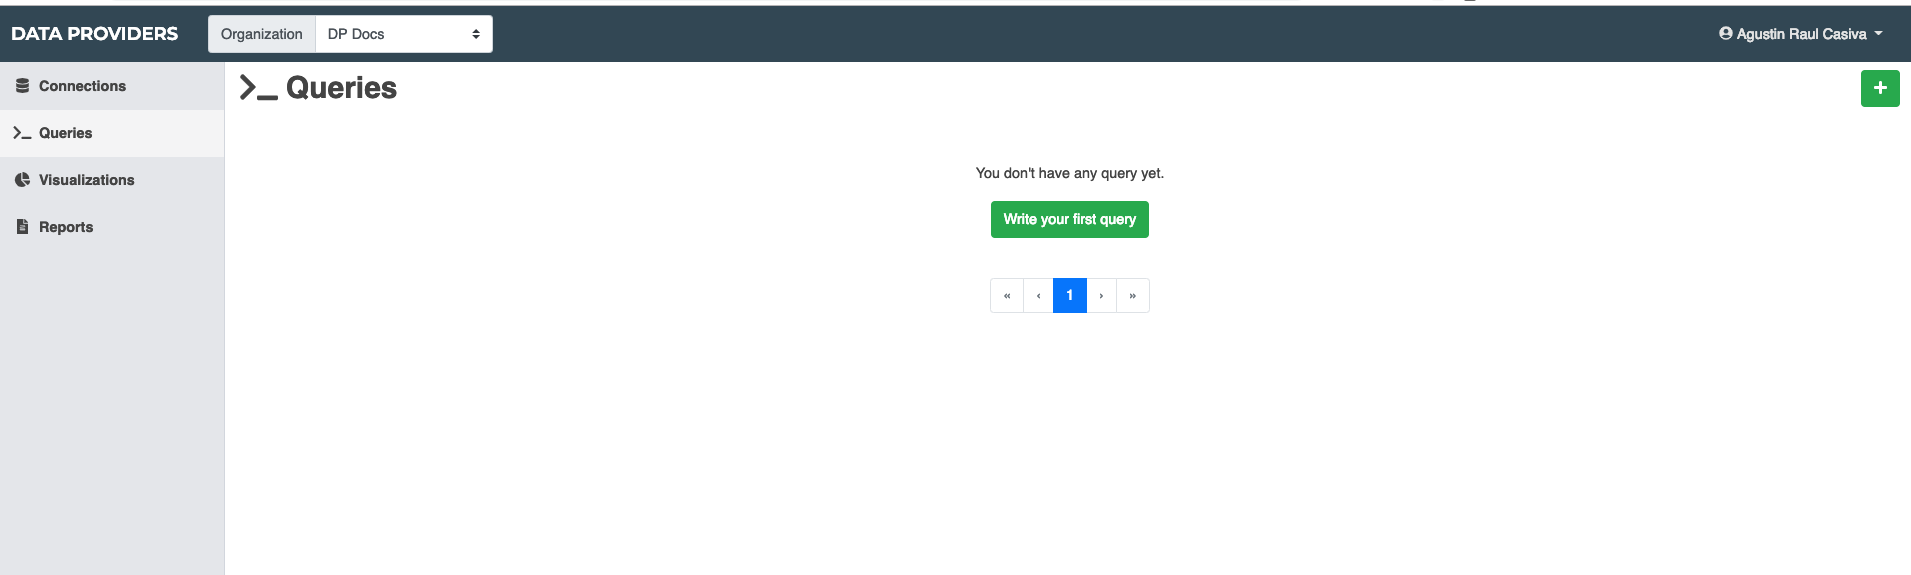
As you can see, as first is empty, click
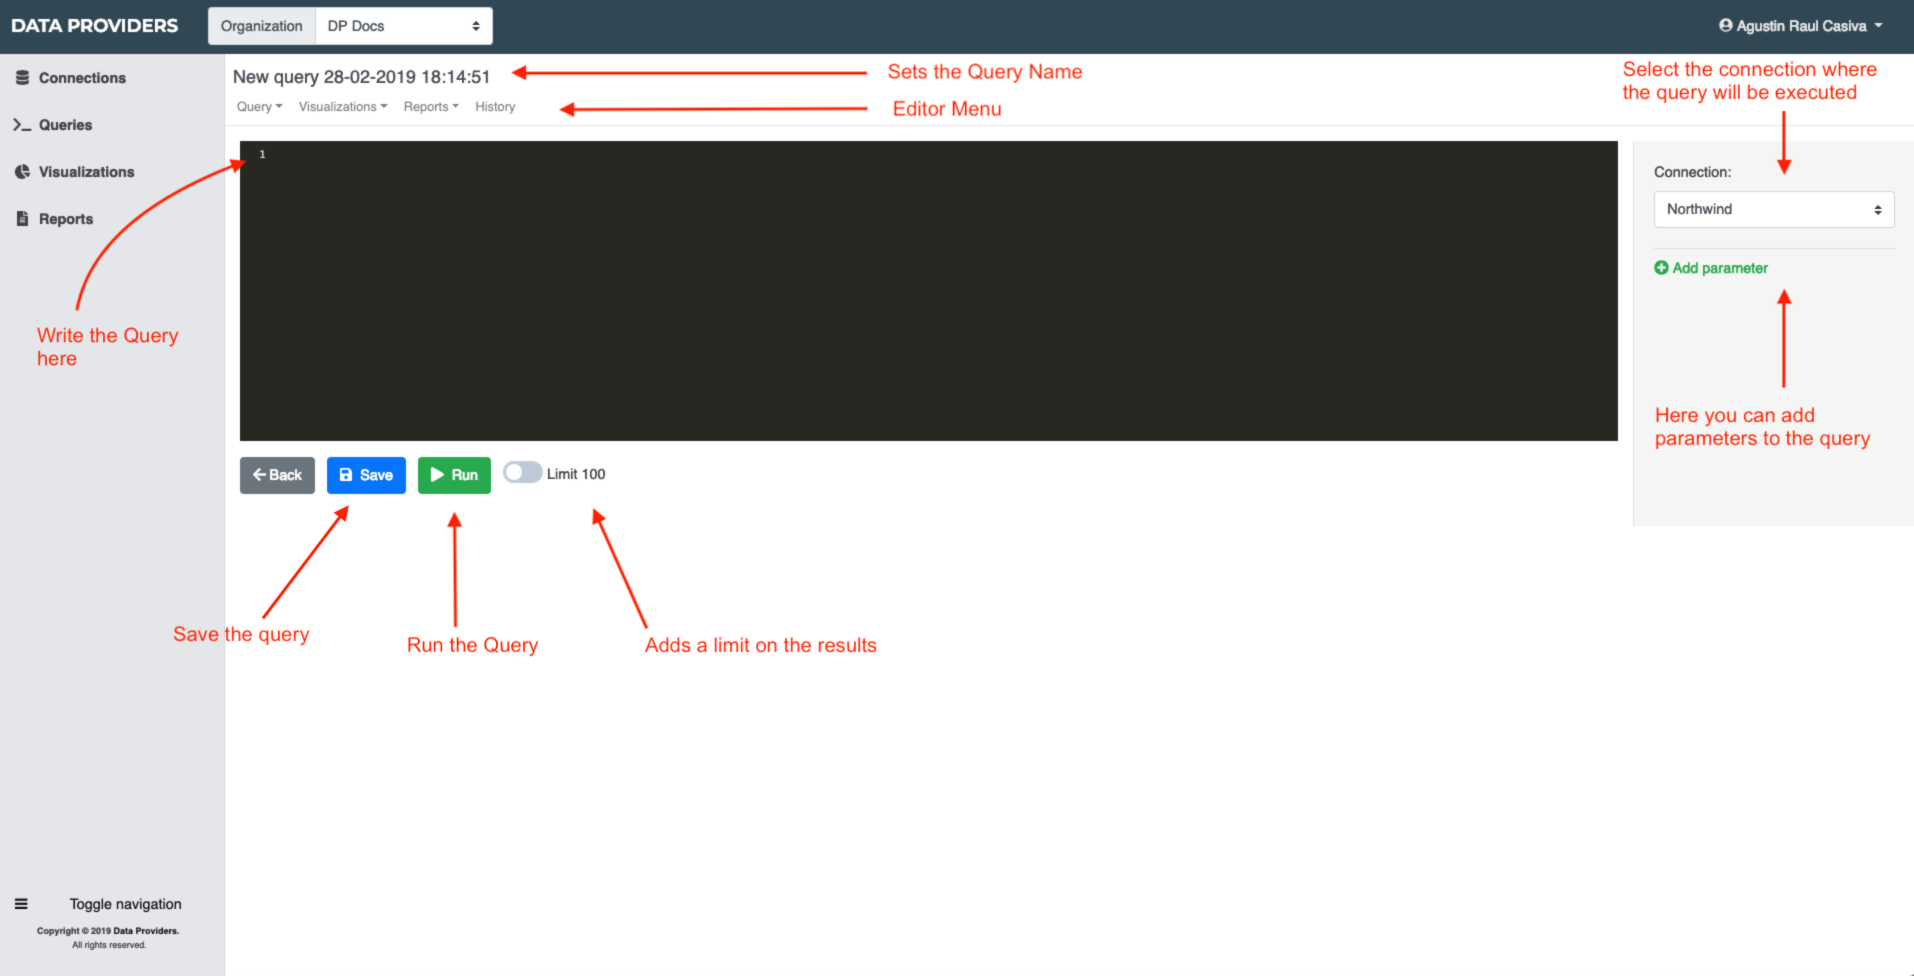
Once you are in the editor you must set a name for the query, will help you to find it later.
In the black area you must write the SQL.
The Run button will execute the query, if there is an error will show a error message, if not will show the results in a table below the edit area.
In the right side the top dropdown defines in which connection will be executed the query, if you have multiple connections you need to setup properly the connection.
Below the connection we have the parameters area, here you can add parameters to the query, we will cover how to use it in the next section.
All queries have a limit of 100 results by default, as you can imagine it is very expensive to transfer millions of records over the internet and also process and present data of millions of records. We in data providers starts on the premise that you will try to get aggregated data to be used in the visualization so we assume that you will retrieve a limited amount of data. However if you need to get more of 100 records you can disable this option and wait until the data is retrieved. Try to keep this limitation in mind to make fast reports.
What we do when the data is retrieved
When we get the data we keep the results on memory to cache the results and avoid to get data from your server all the time.
Every time you hit play in the query editor or click in refresh into a report or visualization we will hit your server to get fresh data, in any other case we will read from our cache.
The cache is temporal storage, is not something permanent and it will be deleted at any time, we don’t store your data permanently.
Execute the query
For this documentation we are using the famous sample database from Microsoft called Northwind, basically this is a database for a store. In order to give a sample of how to write a query we will try to get from the database the most sale products.
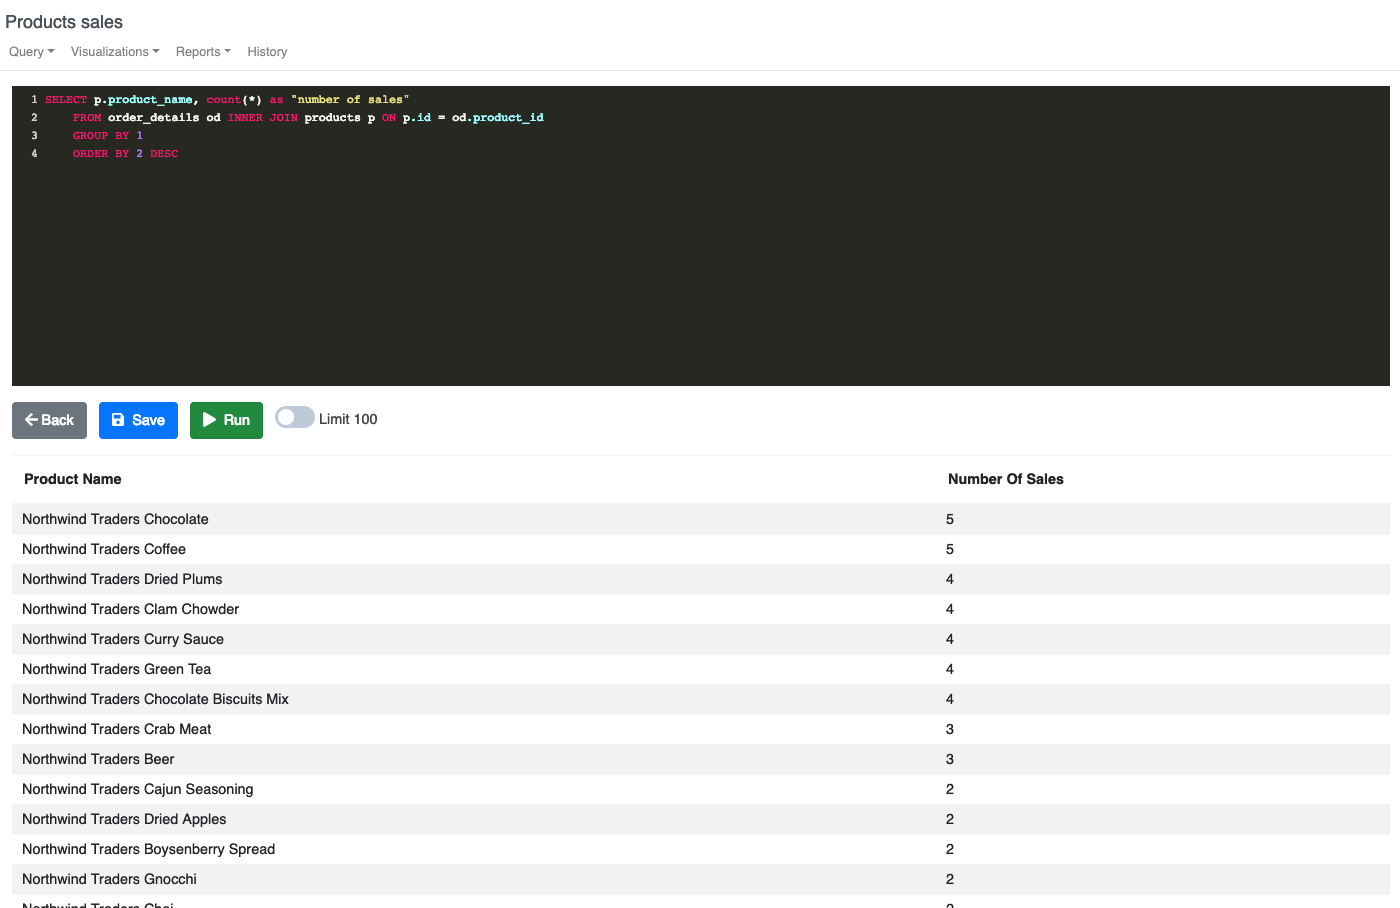
We have an order_details table where we have the products on each order, we need to get the product name in order to get a description of the products that have been sold, this query must do the requirement
SELECT p.product_name, count(*) as "number of sales"
	FROM order_details od INNER JOIN products p ON p.id = od.product_id
    GROUP BY 1
    ORDER BY 2 DESC
As you can see we do an Inner Join between orders_details and products using the product_id.
In the selection list you can see that we are using product_name and a count function to identify how many times the product was sold, in the same line we are using the operator as to rename the result column name, that will be used later as label in the visualization, so be very clear here thinking in the users that will see the report.
We are using GROUP BY because is needed by count and also sorting by number of sales to get the most wanted first.
Hit run and see what happens, you must be seeing something like this
You can modify and run the query as many times as you want until you get the data that you are looking for. Once the query works and you are satisfied whit the results you must save the query changes. That’s it, you have your first query 🙂
Once you are set the next step is to create a visualization for the data, you can use the menu editor, select visualization and clicking in the New entry will create a new visualization using this query. If not, you can go to visualization on the side menu, click in new (plus sing on the right), and select the query from the right panel of visualization.
Parametrize your Query
Queries can be parametrized to get data following specific criteria. Let’s assume for example that you need to get the same information but for a given period of time (from / to).
The order date is in the order table, so
SELECT p.product_name, count(*) as "number of sales"
	FROM (order_details od INNER JOIN  orders o ON od.order_id = o.id)
        INNER JOIN products p ON p.id = od.product_id
    WHERE o.order_date BETWEEN :from AND :to
    GROUP BY 1
    ORDER BY 2 DESC
As you can see we have used two placeholders for the parameters :from and :to, this placeholders will be filled at execution time with the parameters that we will define in the right panel.
You need to add two parameters, one for from and other for to. The parameter forms ask for a Label, a human readable name of the parameter, and for a default value. Data provider will generate a machine name from the label that will define the name for the place holder.
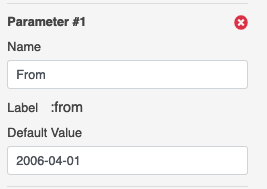
You can add as many parameter as you need.
Finally, when you complete the parameter definition you can execute the query, you must see something like this.
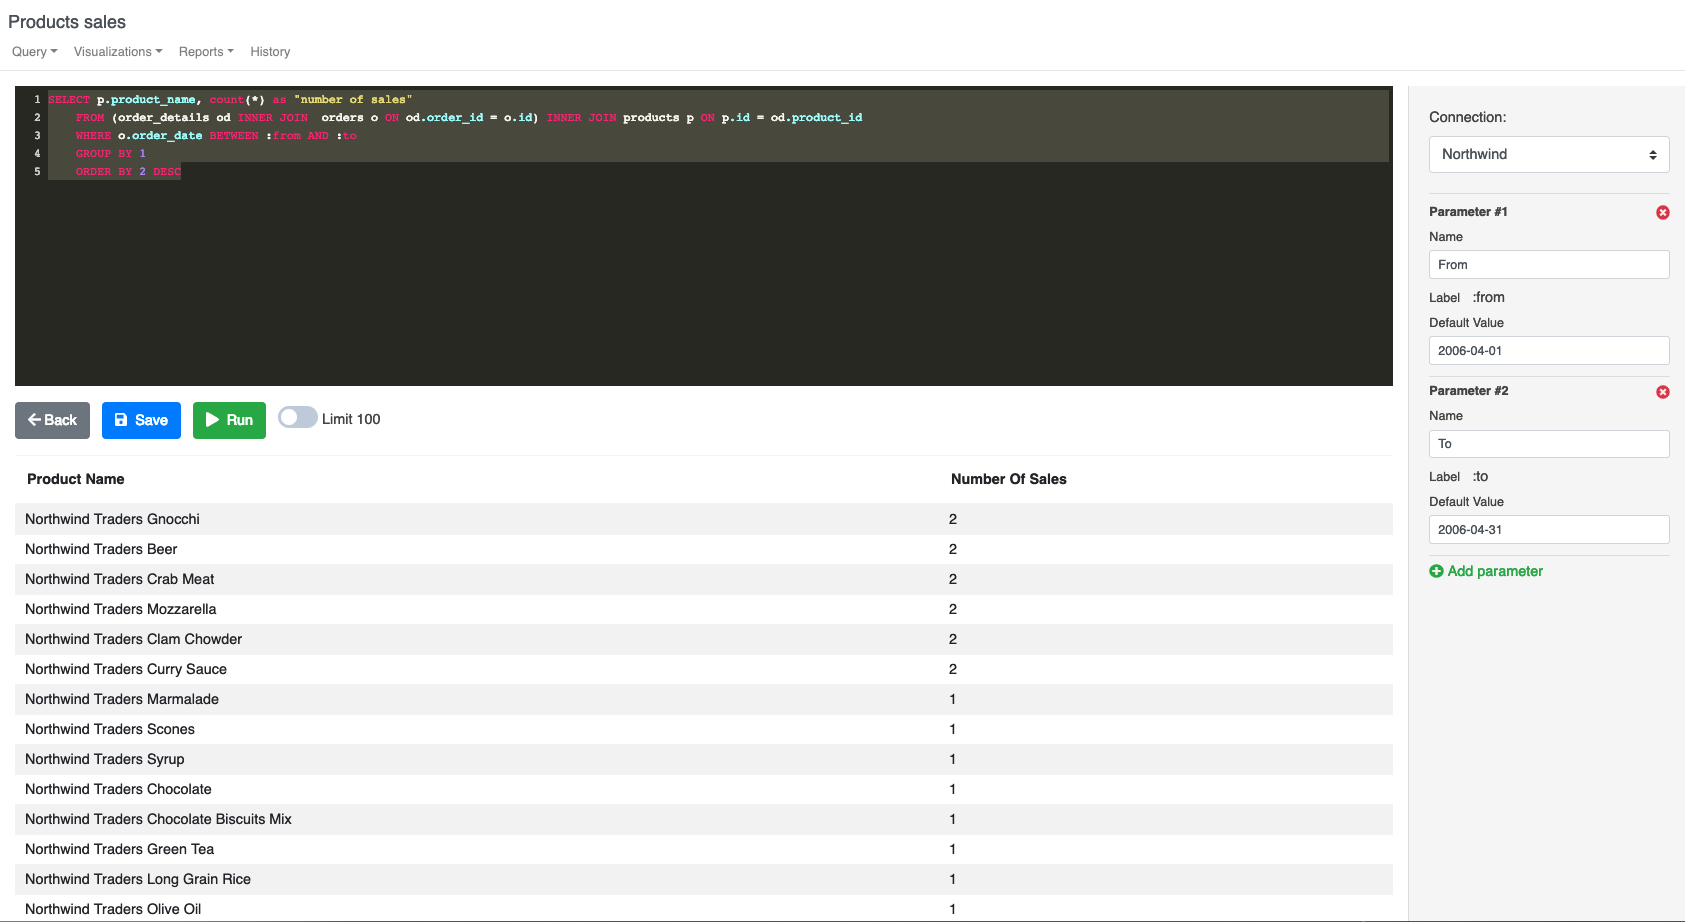
In the Editor view you can only preview data with the default parameters, however in visualizations or reports you’ll have a form with all the parameters of all the involved queries, so you can change the values to get different data. We will see more examples in the visualization and report section.
This example shows a date parameter however you can make parameters for any kind of string such as Numbers or Date, the expression of the value must be compatible with your RDBMS, you can think as the value of the parameter will be “copy-pasted” into the placeholder.
Resume
As you can see this is just SQL, don’t be afraid of use your imagination to build the required query to get the data that your need.
Be very expressive in the selection list to select good names for the fields, the fields names are used in the visualizations.
Avoid retrieve huge datasets, do aggregations and limits in your queries to retrieve only what you need. Use the selection list to get only the required fields, don’t do “SELECT * FROM” if you don’t need all the fields.
Some visualizations as Number will only read one row to show the value.
Once you have your data, the next step is to make a visualization of it.